GDB
Another way to analyze binaries is by doing it dynamically. Basically, you're watching exactly what the program does while it's actually running, instead of just staring at its static code. This whole process is known as debugging, and tools like GDB are here to help you get the job done.
What can a debugger do?
A debugger lets you dive deep into a program and see what's actually happening under the hood. You can do cool stuff like inspecting or even straight-up modifying memory while the program is running.
Installation
The default gdb installation is really easy, but you either need to have a Linux OS or use WSL (Windows Subsystem for Linux)
that you can learn about here -> WSL-docs.
To install it, you can just use your package manager (apt, dnf, ...).
On a Debian-based distribution, you can just run in your terminal:
sudo apt update
sudo apt install gdb git python3 python3-pip
# you might as well install the other *software* that you'll need later
GDB is really powerful but honestly, if you don't use any plugins, the usage can become kinda difficult. We sincerely recommend using the pwndbg plugin that is perfect for what we need to do (rev & pwn).
Here's how you can install the plugin:
git clone https://github.com/pwndbg/pwndbg
cd pwndbg
./setup.sh
The reason for choosing pwndbg over standard GDB is quite simple.
This is what gdb alone shows you:
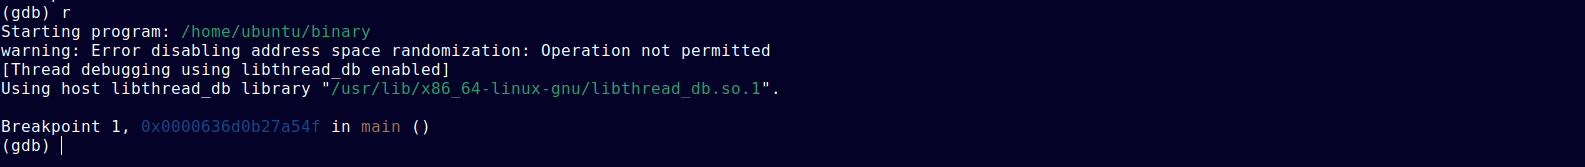
And this is what pwndbg shows you:
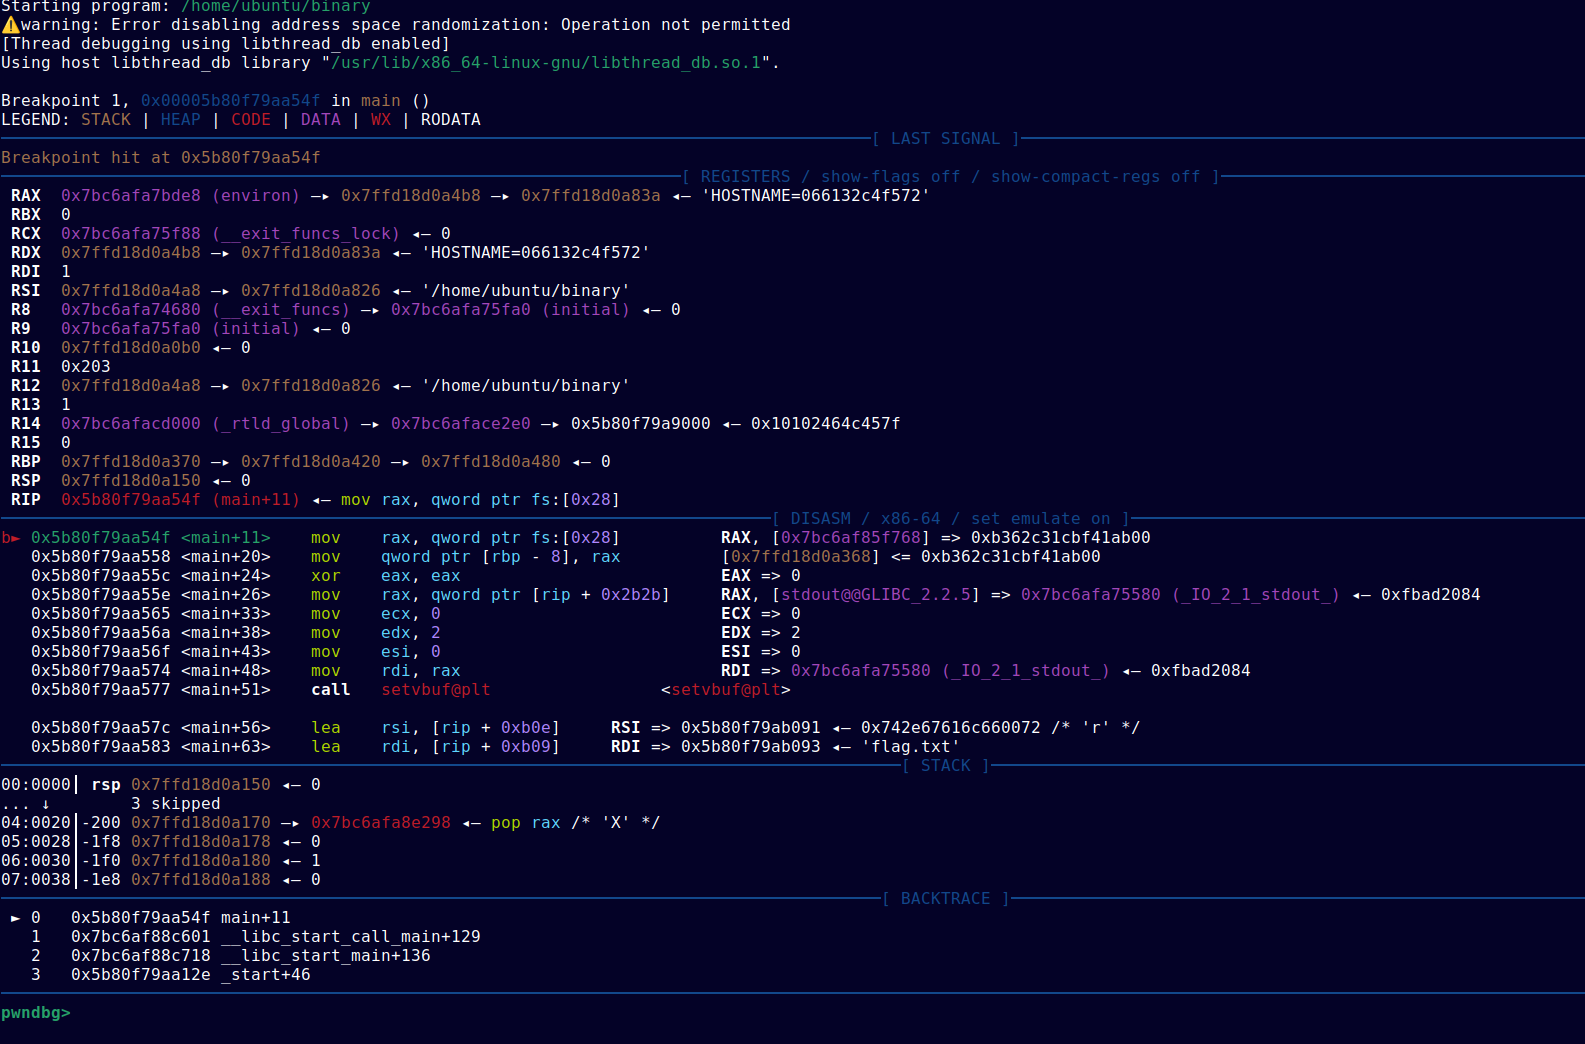
The amount of information that pwndbg gives you is just insane.
Basic Usage
Using pwndbg is pretty straightforward if you're just getting started, but it can get pretty deep once you hit the advanced stuff.
First off, pick the binary you want to debug and make sure it's executable:
chmod +x [binary-name]
To fire up the debugger, just run:
gdb [binary-name]
Now you're in the pwndbg shell and you can start debugging!
The most important command is break (or just b), which lets you set a breakpoint at a function. Just type:
b function-name
After that, start the program by typing run (or r). The program will run until it hits that breakpoint you just set.
Once you've hit a breakpoint, you can step through the program one assembly instruction at a time using ni (short for next instruction).
You should see something like this:
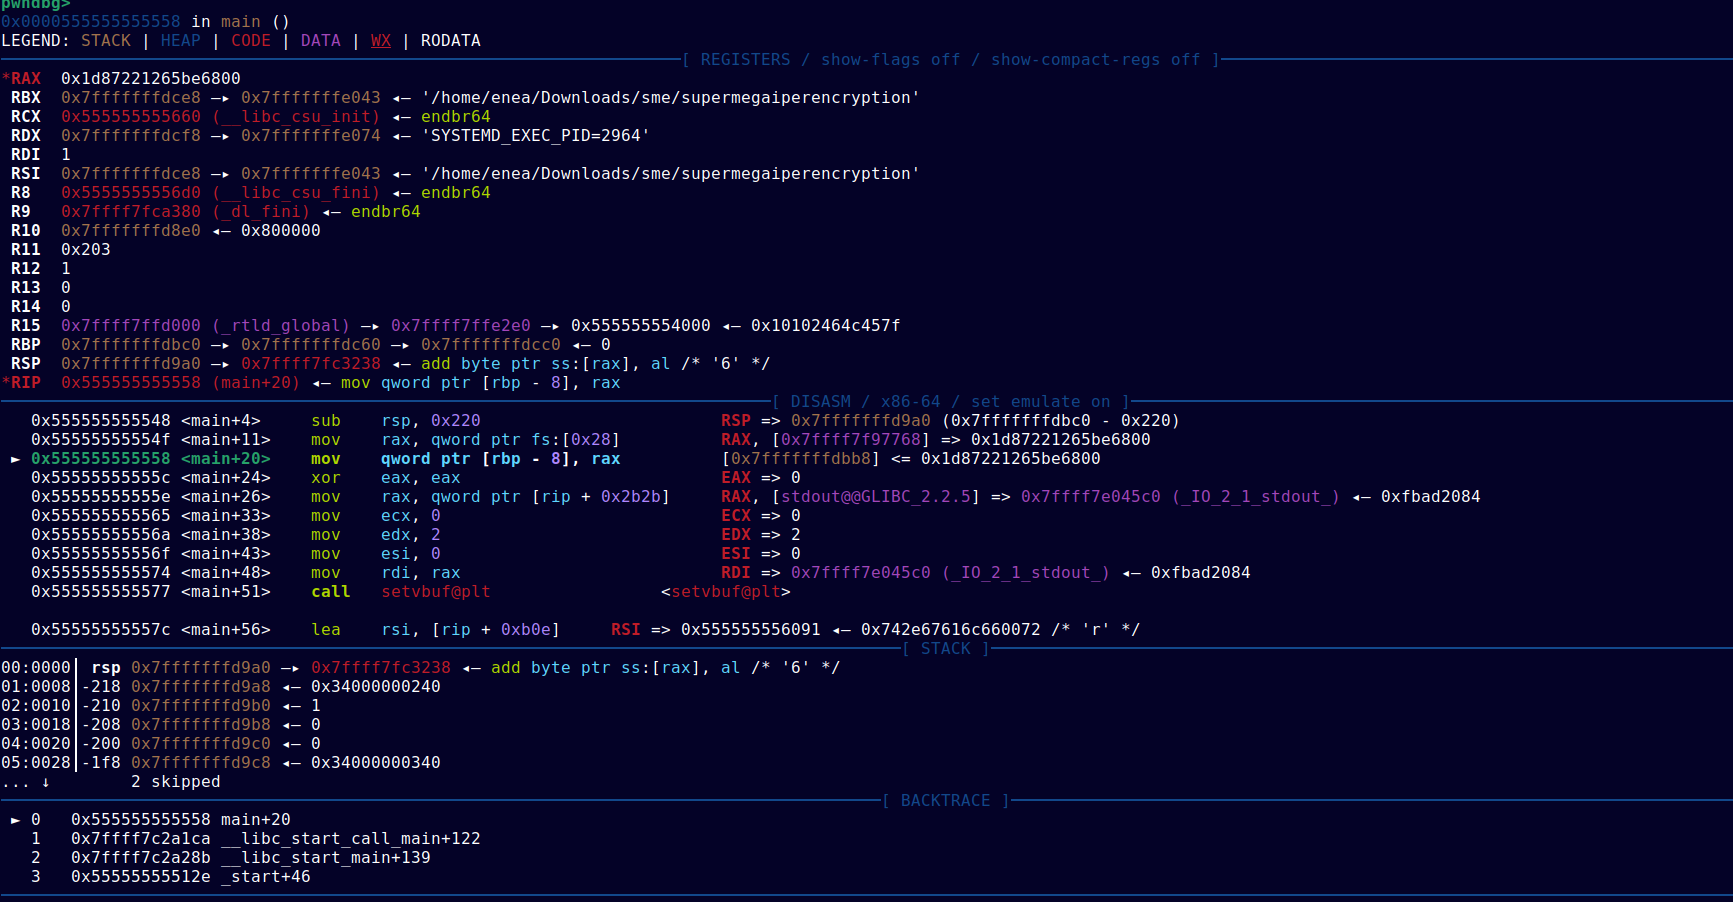
The amount of info pwndbg throws at you can be overwhelming at first, but here's the explanation of each section:
-
Looking at the interface in your terminal (or the photo), the top section shows the registers (like
raxorrsiin x86_64). Registers are small, super-fast storage inside the CPU. You'll see a lot of hex values here, which are usually memory addresses pointing to other data. -
In the second section, pwndbg shows the assembly code of the function you're currently analyzing. On the left, you've got the memory addresses, and in the middle is the actual assembly, including calls to other functions like
printf. -
The last big section is the stack. This is a chunk of memory where functions store temporary data (like local variables). We'll dive deep into the stack in the Stack section.
More advanced commands
With what you've read so far, you should be able to handle basic debugging. But if you need to do something more specific, here are some other commands that'll probably be useful:
-
stack→ with this command, you can analyze the stack in more detail. You can usestack <number>to decide how many "slots" of the stack you wanna look at. -
telescope→ you can pass an address to this command to see what values are in that memory
area usingtelescope <address> <number>. (you can just use tel). -
x→ short for examine, this lets you inspect memory addresses in some cool ways. The syntax is pretty simple:x/<n><f> <address>.nis the number of memory chunks you want to analyze. The format (f), on the other hand, is what makes this command so powerful. You can useito make gdb interpret the memory as instructions,sfor strings, orxfor hexadecimal data. There are tons of formats for this command, but listing them all here would take forever. -
si→ this command is super similar toni, but with one major difference. If the program makes a call to another function,nisteps over it (running the whole function in the background). On the other hand,si(step instruction) steps into the function so you can analyze it line by line.